
Your data, finallytelling the
right story.
Connect every data source, build stunning dashboards, and share insights that drive decisions — without waiting on your data team.
Reporting & analytics
2 min
to your first dashboard
150+
data source connectors
6X
faster reporting cycles
2 min
to your first dashboard
150+
data source connectors
6X
faster reporting cycles
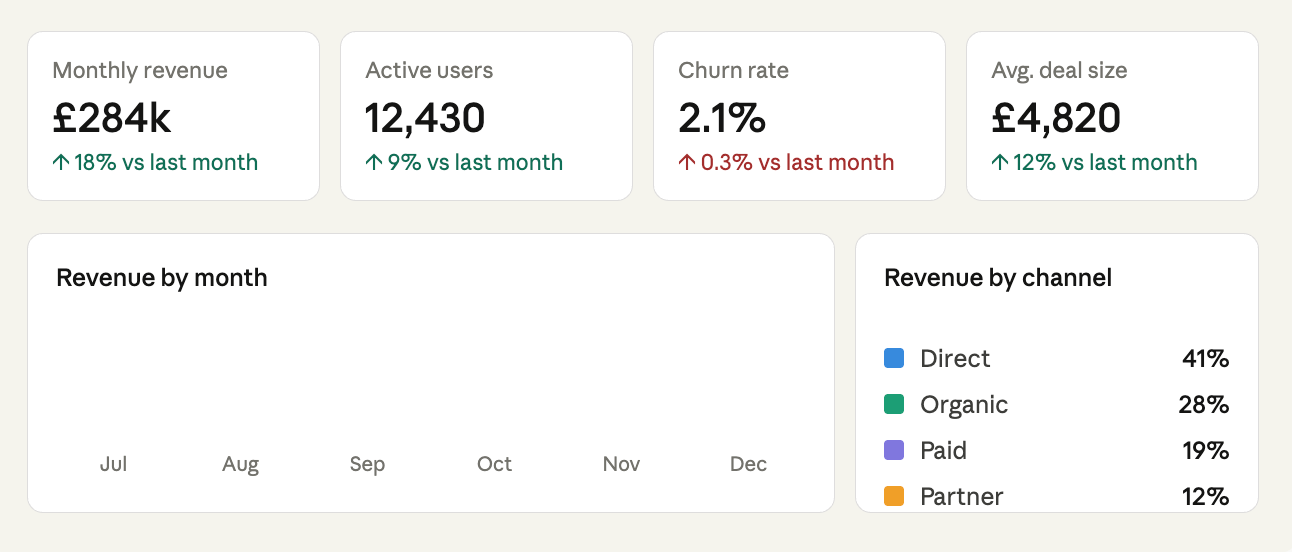
Live dashboard
Everything in one view. Always up to date.
Real-time dashboards that pull from every source — your CRM, database, ad platforms, spreadsheets, and more. No SQL. No waiting.
Live dashboard
Everything in one view. Always up to date.
Real-time dashboards that pull from every source — your CRM, database, ad platforms, spreadsheets, and more. No SQL. No waiting.
Features
Built for teams who need answers fast
From self-serve dashboards to scheduled board reports — Lumio gives every stakeholder the data they need, in the format they want.
Features
Built for teams who need answers fast
From self-serve dashboards to scheduled board reports — Lumio gives every stakeholder the data they need, in the format they want.
⊞
Drag-and-drop builder
Build any chart, table, or KPI card without writing a single line of code. Pixel-perfect layouts in minutes.
⊛
Real-time data sync
Connect live data sources and watch your dashboards update automatically — no manual refreshes needed.
⊞
Drag-and-drop builder
Build any chart, table, or KPI card without writing a single line of code. Pixel-perfect layouts in minutes.
⊛
Real-time data sync
Connect live data sources and watch your dashboards update automatically — no manual refreshes needed.
◈
AI-powered insights
Ask questions in plain English and get instant answers, chart suggestions, and anomaly alerts surfaced automatically.
◉
Scheduled reports
Deliver the right report to the right people on a schedule — daily digests, weekly recaps, or monthly board packs.
◈
AI-powered insights
Ask questions in plain English and get instant answers, chart suggestions, and anomaly alerts surfaced automatically.
◉
Scheduled reports
Deliver the right report to the right people on a schedule — daily digests, weekly recaps, or monthly board packs.
⊕
Custom metrics
Define your own KPIs with a formula builder. Combine fields across sources to track the numbers that matter to your business.
⊟
Sharing & permissions
Share live dashboards with a link, embed them in Notion or Confluence, or export as polished PDFs for stakeholders.
⊕
Custom metrics
Define your own KPIs with a formula builder. Combine fields across sources to track the numbers that matter to your business.
⊟
Sharing & permissions
Share live dashboards with a link, embed them in Notion or Confluence, or export as polished PDFs for stakeholders.
Report types
Every report your business runs on
Pre-built templates for the most common reporting needs — ready in seconds, fully customisable from there.
Report types
Every report your business runs on
Pre-built templates for the most common reporting needs — ready in seconds, fully customisable from there.
▦
Executive dashboard
Top-line KPIs for leadership — revenue, growth, churn, and runway at a glance.
⊛
Sales performance
Pipeline health, quota attainment, win rates, and rep-level breakdown.
◈
Marketing attribution
Channel ROI, campaign performance, and conversion funnel by source.
▦
Executive dashboard
Top-line KPIs for leadership — revenue, growth, churn, and runway at a glance.
⊛
Sales performance
Pipeline health, quota attainment, win rates, and rep-level breakdown.
◈
Marketing attribution
Channel ROI, campaign performance, and conversion funnel by source.
◉
Product analytics
Activation, retention curves, feature adoption, and user journey maps.
⊕
Financial reporting
MRR, ARR, burn rate, and forecasts built directly from your source data.
⊟
Customer success
Health scores, NPS trends, churn signals, and account expansion tracking.
◉
Product analytics
Activation, retention curves, feature adoption, and user journey maps.
⊕
Financial reporting
MRR, ARR, burn rate, and forecasts built directly from your source data.
⊟
Customer success
Health scores, NPS trends, churn signals, and account expansion tracking.
What people say
Trusted by data-driven teams worldwide
What people say
Trusted by data-driven teams worldwide
"We used to spend two days a month building the board pack manually in Sheets. Now it's a scheduled report that goes out automatically every Friday. Our board actually reads it now."
SR
Sarah Reid
CFO, Northbrook SaaS
"The AI insights feature caught a drop in activation rates three weeks before it would have shown up in our monthly review. That early warning saved us a serious retention problem."
JO
James Okafor
Head of Product, Velox
"Every team in the company now has their own live dashboard. Marketing, sales, support — everyone knows their numbers without asking the data team. It changed our whole culture around data."
CM
Clara Moss
COO, Fieldline
"Every team in the company now has their own live dashboard. Marketing, sales, support — everyone knows their numbers without asking the data team. It changed our whole culture around data."
CM
Clara Moss
COO, Fieldline
Get started
Your first dashboard in under two minutes
Book a free, no-obligation demo and see what iComm AI Pro can do for your business. We'll show you exactly how it works — no jargon, no pressure.
Get started
Your first dashboard in under two minutes
Book a free, no-obligation demo and see what iComm AI Pro can do for your business. We'll show you exactly how it works — no jargon, no pressure.
